Smartphones are very powerful devices, which can be used to solve engineering problems. Engineers use transfer functions (mathematical representation of the relation between the input and output of a linear time-invariant system) to perform analysis of systems.
Whether you are students struggling with the stability problem of linear time-invariant systems, or teacher trying to invent new exercises, or engineer who need a fast and handy tool to solve their problems, this app is for you.
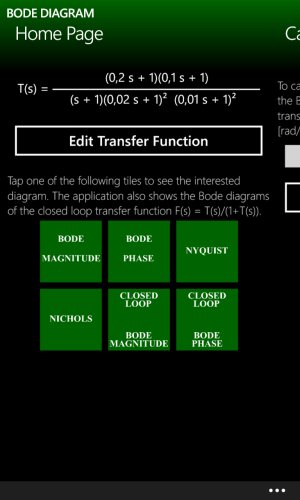
All you have to do is to input the transfer function! The app will calculate the frequency response of the system, and you will be able to see the output plots. The app is able to detect the minimum and maximum breakpoints, which means rapid elaboration.
Here is what the app shows:
+ Zoom and pan of the plots.
+ Save plots in png format (for paid version).
Feel free to review it and don't forget to let me know what features you would like to see implemented!
Paid Version: 1.29€
Link to the Store

Free Version:
Link to the Store

Some screenshots:


Whether you are students struggling with the stability problem of linear time-invariant systems, or teacher trying to invent new exercises, or engineer who need a fast and handy tool to solve their problems, this app is for you.
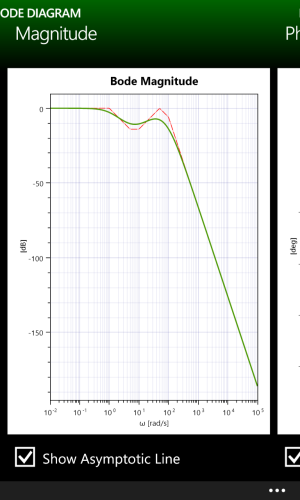
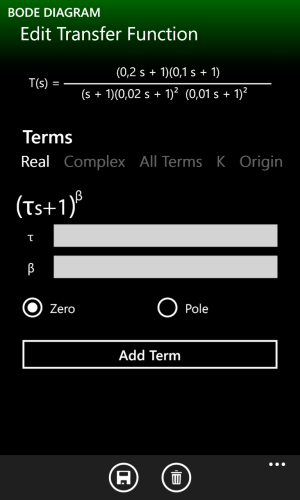
All you have to do is to input the transfer function! The app will calculate the frequency response of the system, and you will be able to see the output plots. The app is able to detect the minimum and maximum breakpoints, which means rapid elaboration.
Here is what the app shows:
- Magnitude and Phase plots.
- Nyquist plot.
- Nichols plot (for paid version).
- Bode magnitude and phase of the closed-loop transfer function (for paid version).
- Save transfer function: so you can easily see a diagram everytime you want (for paid version).
+ Zoom and pan of the plots.
+ Save plots in png format (for paid version).
Feel free to review it and don't forget to let me know what features you would like to see implemented!
Paid Version: 1.29€
Link to the Store

Free Version:
Link to the Store

Some screenshots:


Last edited:


