Heart Rate Graph in Sleep Mode

joeactuary

New member
Nov 25, 2012
17
0
0
Visit site
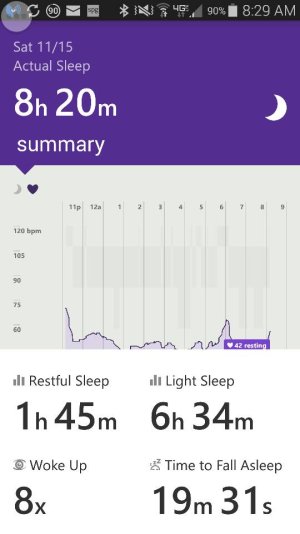
i've seen the same thing every day after loooking at the prior night's sleep activity. The resting heart rate never seems to be within the range of the heartbeat graph. For example, last night, my resting heart beat was 48 but the graph makes it appear that my heart beat ranged from 55 to 65. Not sure what is wrong. I'm guessing the Y-axis scale of the graph is wrong but perhaps I'm not understanding how to interpret "resting heart beat"?
 

mhc48

New member
Nov 8, 2010
327
0
0
Visit site
My Resting Heart Rate is always lowest in the latest (or earliest depending on point of view) part of my sleep period. The graph is so tiny on my phone that I'm glad the App states exactly what it was, but it seems within the range of the rest of the graph.
 

joeactuary

New member
Nov 25, 2012
17
0
0
Visit site
So Fri night, once again, my resting heart rate is not within the graph's range. it shows my resting heart rate as 49 but the graph clearly never touches 50 or below. Either the scale is wrong, the graph is wrong, or the resting heart rate is wrong. Or I'm misinterpreting what "resting heart rate" means which i guess is understandable as Microsoft doesn't define it or explain how it's calculated. Perhaps resting heart rate is calculated based on cumulative wear, not just that one night's sleep?
 
Last edited:

joeactuary

New member
Nov 25, 2012
17
0
0
Visit site
Sat night, band says my resting heart rate is 45. But the graph doesn't go below 50. The resting heartbeat is either complete BS or it's being calculated instead of recorded. Anyone know how it's being calculated?
 

joeactuary

New member
Nov 25, 2012
17
0
0
Visit site
Exactly. We don't know. Throws into question anything the band is telling us in sleep mode. This is a serious bug that makes the whole sleep activity tracker pretty worthless till it is fixed.
 

cvflowe

New member
Nov 29, 2012
73
0
0
Visit site
Wow, a 40s heart rate is pretty low if that's measured correctly. Unless you are really athletic. Looking at my graph on the software app, the range is 40bpm-80 so joeactuary you should be getting a reading. Did you update your software?
 

mhc48

New member
Nov 8, 2010
327
0
0
Visit site
wp_ss_20141109_0001.png I really can't understand what you guys are saying unless I'm totally misreading these posts. My resting heart rate during sleep has been consistently in the mid 40s and each time the dot representing where it hit that lowest level has been consistently within the axis of the graph. And @joeactuary does your graph literally not go below 50? My left axis goes to 30 as the bottom level and appears to show space for another 5-10 beats below that level (not my heart rate, just the scale).
 
Last edited:

joeactuary

New member
Nov 25, 2012
17
0
0
Visit site
Thanks both for your replies!

CV, my sleeping heart rate ranges from 50 to 70 based on the graphs, but it says my resting heart rate is around 45 to 46. It's paired with an iphone. I don't think the software has been updated. i don't see any updates in the ios store and that's how I thought it would be updated?

MHC, my y-axis looks very similar to yours, starting at about 25. What is different though is that your 46 resting heartbeat is clearly shown on your graph as a purple dot. On my graph there is no purple dot showing my 46 resting heart beat (because my heart rate is never going below 50).

Perhaps this bug is only being seen with the IOS app?
 

DroidUser42

New member
Nov 7, 2014
1,026
0
0
Visit site
Perhaps this bug is only being seen with the IOS app?

I'd think any graphing issue would be an issue with the app, not the Band. The Band only reports data, it doesn't draw a graph.

I have the android version and while the graph looks a bit questionable, it's hard to say it's wrong. Most of my marks are in increments of 15 bbm and there's no lines from the numbers across the graph.

I wonder if the issue is that the graph averages some readings while the label is taking the lowest reading ever?
 

joeactuary

New member
Nov 25, 2012
17
0
0
Visit site
Every single night, the resting heartbeat is below the lowest point of the heart beat graph of that night's sleep on the ios app. Anyone figure out it if the resting heartbeat is measured or calculated?
 

dbregman

New member
Nov 3, 2014
108
0
0
Visit site
Interesting. There is obviously a difference by platform. (May I suggest people post the platform when mentioning an issue) while. The graph on my android looks correct
The x axis is not as alow as others here. It bottoms out at my resting. It would be more useful if like someone else's here it dropped to 15 bpm.
 

Attachments

  • 1416156151218.jpg
    1416156151218.jpg
    43.3 KB · Views: 2

DroidUser42

New member
Nov 7, 2014
1,026
0
0
Visit site
Every single night, the resting heartbeat is below the lowest point of the heart beat graph of that night's sleep on the ios app. Anyone figure out it if the resting heartbeat is measured or calculated?

If you look at the exercise graph I posted in this thread, you'll see the graph only goes a bit over the 133 line, but shows a peak of 143 which would make it over half way to the 149 line. In my own data record taken from the display, I did see 143 however briefly.

So I think the answer is the resting heartbeat is measured, but the graph is smoothed and may "smooth out" the lowest measured point. Which raises the question, did you really reach that point, or was it a measurement anomaly? Either way, I think it's safe to say you didn't reach it for very long.
 

Members online

Forum statistics

Threads
323,252
Messages
2,243,521
Members
428,049
Latest member
velocityxs