Hi all,
i have built the gym app 'fitness log' and am currently doing a new build.
i have hit a roadblock on the analysis section- i'm not sure if i should i use a line or bar graph!?
pros and cons-
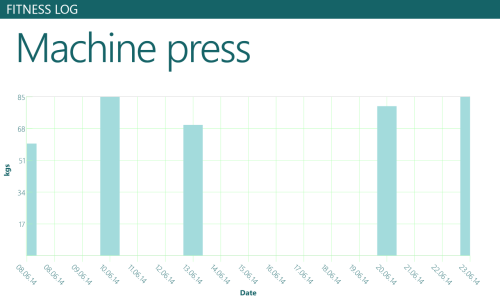
bar graphs- fills the screen and make it look nicer *excellent for cardio analysis
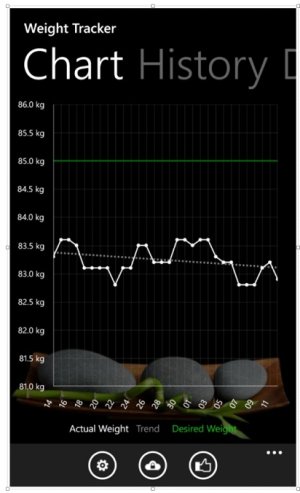
line graphs- more information can be extracted and compacted in the same window. *excellent for weight analysis
Ideally i would like to use both graphs (bar graph for cardio and line graph for weights) however, i have been told that this isn't possible with telekrik UI controls. is this correct? If not, any material on how to do this will be greatly appreciated.
whats your opinion- do you prefer bar graphs or line graphs for viewing data?
ps- if you specialise in telekrik or similar controls that you know how to customise send me a PM.
thanks in advance!!!
screen shots of different graphs.


